
What is the Appreciation Rate for San Juan County Real Estate?

In the course of my real estate business, I am often asked by clients what percentage of appreciation they should expect if they invest here. It is a very difficult question to answer because, in my opinion, our market is not large enough to accurately calculate appreciation.
On an individual property, you could calculate average appreciation or depreciation per year by taking the current appraised value less the acquisition price. The gain or loss is then divided by the number of years owned and converted to a percentage. Remember, real estate agents are not licensed to prepare a market value opinion for a property unless it is for the purpose of buying or selling. The Washington State Department of Licensing prohibits agents from providing opinions of value for estate planning, divorce, litigation, and IRA evaluations. To determine the appreciation of your individual property, you would want to contact a Washington State licensed appraiser.
The data is simply not available for an agent to state that San Juan County appreciates by a specific percentage over the last five years. Most of the construction on the islands has been, and continues to be, custom homes. Other than condominium complexes, very few homes with an abundance of similarities have been built. Therefore, we do not have enough comparable homes being bought and sold within a short period of time to accurately calculate average appreciation.
For several years, Zillow estimated what they called an appreciation calculation in rural markets, including San Juan County. I am sure they relied on their proprietary programs and believed the results to be accurate. However, they eventually stopped offering that calculation to the public. I suspect they realized that in small rural real estate markets, such as ours, their algorithms do not perform as well as they do in large metropolitan areas with hundreds of sales and numerous similar homes closing per month.
I have studied our real estate market for more than 30 years and have used numerous indexes to monitor the market trends. Regularly, I review median prices for land and homes, days on market, average home and land prices, and the percentage sellers negotiate off their list price at the time of sale. These indexes reflect trends in market direction, but none of them provide an appreciation calculation. Due to the size of our market and the limited number of transactions each month, we often review data over a rolling 12-month period to analyze most of these indexes. Comparing a Year-over-Year works for some indexes, but not all.
Bottom-line, our market is simply not large enough for one of the universities' economics department to collect and study the data and produce regular reports. The Northwest Multiple Listing Service, (NWMLS) which all local agents are members, does provide statistical data, but it is compiled in a way that best serves metropolitan markets. In rural counties, the data can be distorted.
For example, most of the indexes are compiled monthly. In a small market, the result is that the numbers can vary wildly from month-to-month, especially average home price and median home price. The data from the NWMLS can be very confusing for buyers trying to analyze our market or for sellers trying to determine whether it is a good time to list their property for sale.
One of the analyses I have conducted several times during my career is a review of the entire real estate tax assessment base as issued by the County Assessor. That information provides me with data over a longer period of time and reflects their adjustments; both up and down, based on the changing market conditions. On the chart below, you can see that the Assessor has calculated the total value of the county's real estate assessment base, adjusting for recessions, market slowdowns caused by events such as the dot-com bust and wars, as well as periods of aggressive growth during events such as COVID.
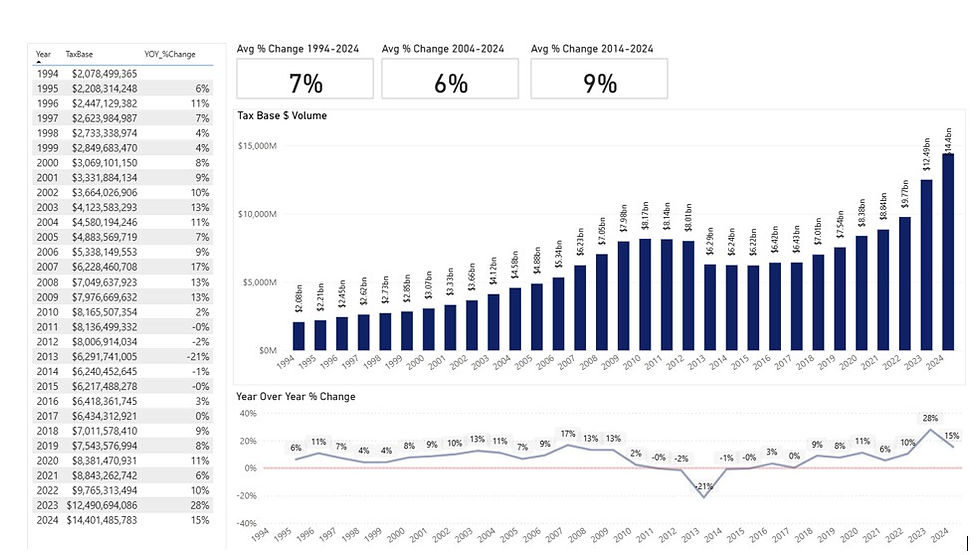
For the last 10-year average, the increase in the total assessed value of real estate in the County has been approximately 9% per year. For the 20-year average and 30-year average, the percentage was 6% and 7%, respectively. The 10-year period is less reliable as it includes the COVID acceleration, and it is unlikely that will occur again. These figures include all property types: residential homes, condominiums, vacant land, commercial properties, multifamily properties, and manufactured homes.
Another item to consider during the long-term analysis is that our assessor has changed their process several times over the last 10, 20 and 30 years. Most recently they changed to an annual assessment process in 2012 for 2013 taxes, which would contribute to the marked drop in total values from 2012 to 2013. Prior to 2012, they valued on a 3-year cycle, so roughly 2/3 of the County did not change in value each year, only 1/3 was revalued, and it was revalued from its value set three years prior. Changes in the process are necessary but do have an impact on consistency.
This is not an appreciation calculation either, but it is an indication of market value movement. Having said that, the Assessor's valuations are not typically what most people define as market value. The Assessor values property for taxation purposes, not for the marketing and sale of real estate, which is what agents and appraisers do. Therefore, the values will differ because the process is designed that way.
However, the Assessor is consistent in the application of that process. Their office generally lags the market based on the timing of adjustments and the effective dates of new assessments. Being slightly behind the market is, again, a function of their valuation process.
Further, the data from the Assessor's office includes new construction and newly created parcels, which somewhat dilutes the averages. There is no practical way to remove that information from the formula for the years included in the analysis.
The last time I reviewed this information was for the period from 1995 to 2008, and the average increase was approximately 4% per year for all property types, including land.
Based on the current chart, an average annual increase of 6% to 7% for all types of real estate appears reasonable.
As I am a curious person, I tested the approach on ChatpGPT with my primary residence. I input the value of my home based on an appraisal 31 years ago and asked what the average compounded rate of appreciation was through the current value in June 2026. The calculation reflected an average rate of 6.1%. Then I tested another property, for a 20-year period but it was only 4.6%. Granted, that home has lots of stairs which may be keeping the value down. Then, I couldn’t stop, as ChatGPT is addictive, so I tested my hangar, for a 10-year period and the rate was 6.8%. Granted, it is a hangar and we had COVID during the last 10-year period which placed upward pressure on our home values, not necessarily hangars. My experience proves the obvious, different property types with different characteristics may or may not match the average percentage of tax assessor’s movement in the entire County tax base.
To be clear, I am not saying that real estate in San Juan County appreciates at an average rate of 6% to 7% per year for long term holds. Lumping all property types together is never ideal for analysis. Waterfront homes with private docks may appreciate at a much greater rate, while a rustic inland cabin may appreciate at a lower rate. Once again, a bulk appreciation calculation isn’t available.
As with all real estate, long-term value is ultimately driven by location, property type, improvement quality, condition, and market demand.
As with all my articles, the opinions expressed herein are solely my own. And these opinions are based on my personal experience, observations, and from interviewing and reviewing both public and non-public information sources. Anyone interested in understanding their individual property’s appreciation should contact an appraiser.
Written by:
Merri Ann Simonson
Coldwell Banker San Juan Islands Inc.
360-317-8668
June 2026



Comments